How To Create Date Dimension Table With Power Query (M Language)

Do you have the same problem? When the transactions in your data do not have any data entry to the database at the current filter in your dashboard but you want to force Power BI to show the missing date to your own visualization.
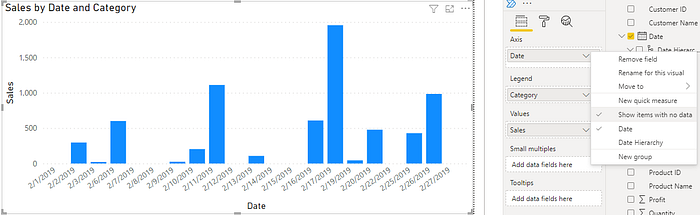
For Example, If you want to visualize sales of the furniture every day in February 2019. But Power BI can’t show all dates in a current month because your data have the missing dates e.g. 1ˢ ᵗ,4ᵗʰ,5ᵗʰ Feb 2019.

In a line chart, you can’t see the real trend of your data because missing dates aren’t shown in the chart which causes misleading insight into your data.

One way that can solve this problem is using the master table which is contained all day every month I usually called “Date Dimension table”. Thus, in creating the date dimension table with Power Query, I’ll lead you to dive into the arts of Power Query in Power BI.
After following my demo you will get the result that is forcing Power BI to show all dates in every applied filter.

Hello everyone, this is my first blog. I’m gonna demo a Power BI technique for creating a date dimension table that relies on an original date column in your dataset step by step. Before we start the implementation, I would like to note my Power BI version as the image below.

Steps
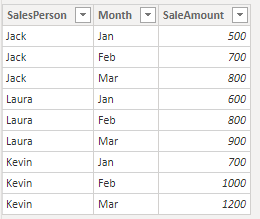
- Connect and load your dataset which already has a date column.
My data source is Orders table with 9994 rows

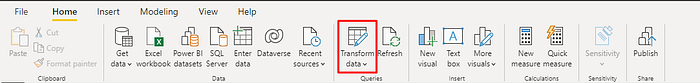
2. Click the Tranformation data button in the Home tab at the toolbar to enter the Power Query Editor.
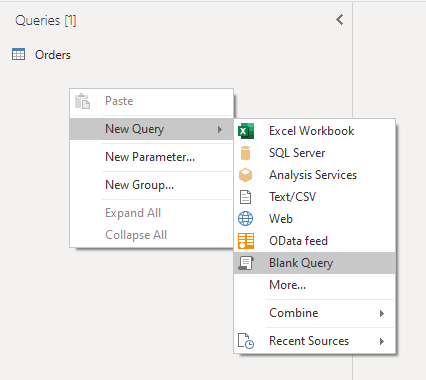
3. Select Blank Query to prepare writing the M language by right click the blank space on the Queries window, then select New Query > Blank Query.
4. Select the created Query (Query 1). Then type this function at the top channel.
= List.Datesto pronounce this query is about the date (or if you want to create a Datetime column you should use = List.DateTimes)
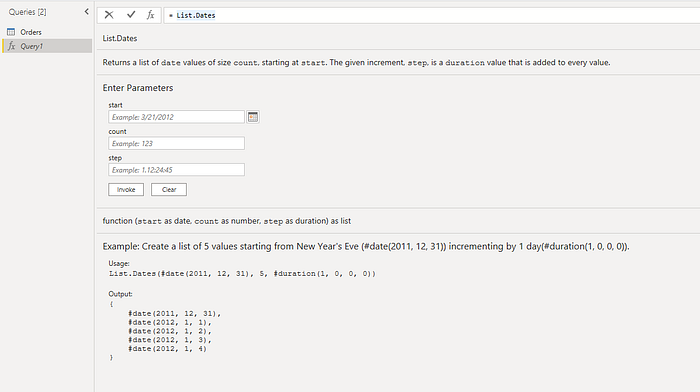
I have to explain how to use List.Dates Function before going to the next step.

List.Dates function composes of 3 arguments; The first argument is Start by the meaning of the start is a start of a date range as you wish in this query. The second is Count means the number of date as you want to create. Lastly, Step is means the jumping of the created date.
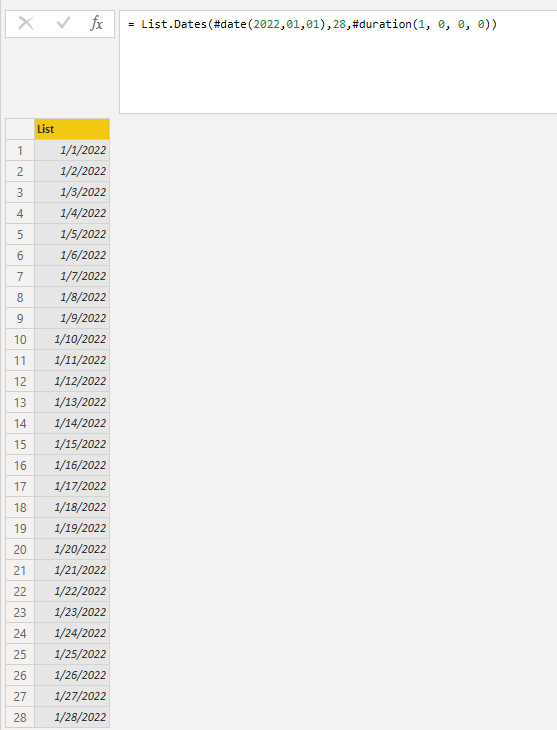
e.g. Start = #date(2022,01,01) (YYYY, MM, DD)
Count = 28
Step = #duration(1, 0, 0, 0) (days, hours, minutes, seconds)
= List.Dates(#date(2022,01,01),28,#duration(1, 0, 0, 0))The result of this function is creating the date column that compose of 01/01/2022, 01/02/2022, 01/03/2022, …, 01/28/2022.
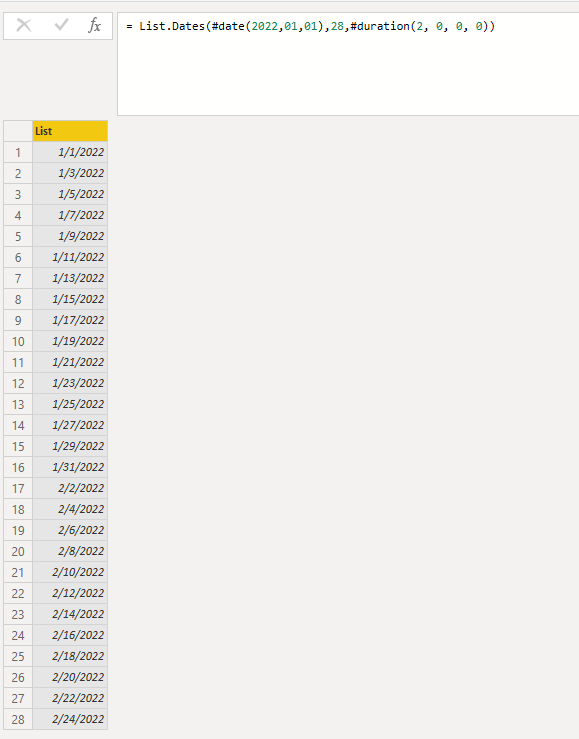
If I change the step to 2 days the created dates are jump 1 step but the result is still end as 28 rows controlled by Count.
5. Integreate List.Dates function with range of the Order Date column.
= List.Dates
(
#date(
Date.Year(List.Min(Orders[Order Date]))
,Date.Month(List.Min(Orders[Order Date]))
,Date.Day(List.Min(Orders[Order Date]))
) //Start
, Duration.Days(
Date.AddDays(List.Max(Orders[Order Date]),1) - (List.Min(Orders[Order Date]))
) //Count
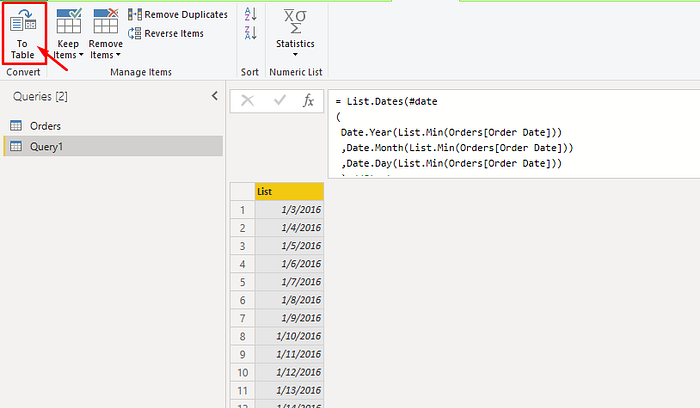
,#duration(1, 0, 0, 0) // Step
)6. Press Enter and click To Table button at the left corner to transfrom the list of dates to a table.
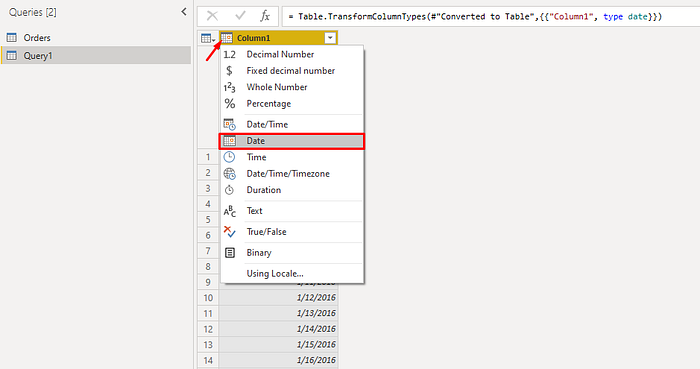
7. The final step is to change the data type of the resulted column to Date. Then, rename the column and the table as you prefer (I name the table to DIM_DATE and the column to Date).
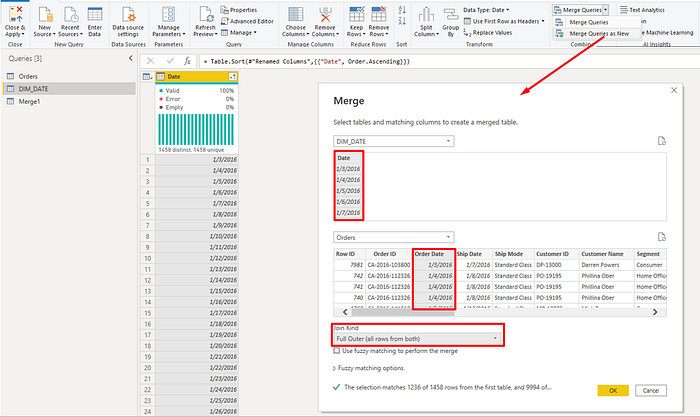
8. The last step is joining table DIM_DATE and Orders together with
Key column: DIM_DATE[Date] and Orders[Order Date]
join type: Full Outer.
After that, you will get the Merge1 table as the result on the left Queries box.
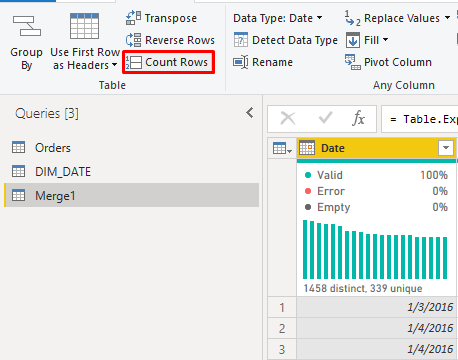
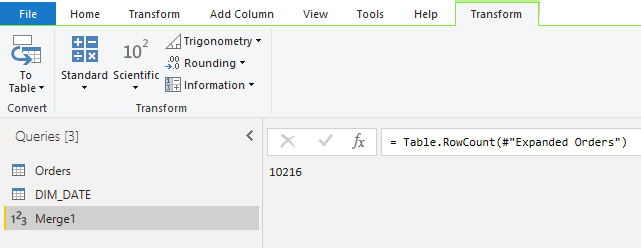
9. Press the Count Rows button of the joined table to ensure that the joining is correct. you will see the result is 10216 rows that come from 9994 as Orders table and 222 rows from DIM_DATE which are missing dates in the Orders table.
10. Click apply button in Power Query.
Afterward, Go back to Power BI to create a bar chart by using the date column from DIM_DATE. Then click show items with no data.
11. If you want to change the value of the missing dates to zero. Go back to the power query then right-click the sales column and use Replace values null to 0.

Result
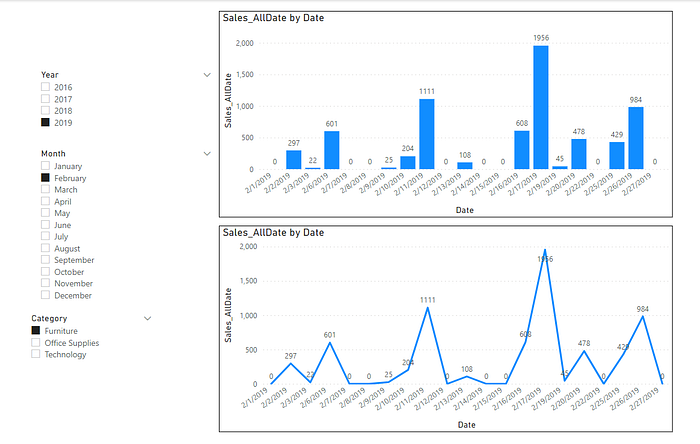
Filter Blank value in the category to show the value of the missing dates.

Extra
If you want to remove Blank in the Category filter you should follow these steps.
- Create a new table named Dist_Category by getting the distinct value of the Category column in the Orders table.

Dist_Category = VALUES(Orders[Category])2. Create a new measure named Sales_AllDate.
Sales_AllDate = CALCULATE(SUM(Merge1[Sales]), Merge1[Category]=SELECTEDVALUE(Dist_Category[Category]) || Merge1[Category]=BLANK())3. Replace Dist_Category[Category] in Category filter and put Merge1[Sales_AllDate] into the values of both charts.
Thanks everyone to come through the end, Hope this demo will help you to manipulate your visualization in your project. See you in the next EP.
Best,
Phakorn Intassingha
Associate Data Analyst
LinkedIn: https://www.linkedin.com/in/phakorn-intassingha-6041b0194/